Why EPSG:4326 is usually the wrong “projection”

…or why spherical coordinate systems are not flat!

One of the most common ways the round world is displayed on a map is using the simplest projection we have:

x = longitude
y = latitude

The name of this projection is “Plate Carree”, and is widely used because it is so simple. However we often seem to forget that we are talking about a projection. Therefore the spatial reference for this projection is very often (mis)referenced as a spherical coordinate system like the following for EPSG:4326:

GEOGCS["GCS_WGS_1984",DATUM["D_WGS_1984",SPHEROID["WGS_1984",6378137,298.257223563]],
PRIMEM["Greenwich",0],UNIT["Degree",0.017453292519943295]]

GEOGCS denotes “Geographical Coordinate System”, meaning a spherical coordinate system using angles for latitude and longitudes, not X’s and Y’s. However, the moment we project this map onto a flat screen or piece of paper, we projected the coordinate system (using the simple formula above), so how can the spatial reference of our map be the above one?

I found that in ArcMap you can manually define a projected coordinate system that renders the same map, but correctly identifies the coordinate system as being projected. Below is the Well-known-text representation of this projection string (note how PROJCS denotes projected coordinate system, and how EPSG:4326 is defined inside it):

PROJCS["World_Plate_Carree_Degrees",GEOGCS["GCS_WGS_1984",
DATUM["D_WGS_1984",SPHEROID["WGS_1984",6378137,298.257223563]],
PRIMEM["Greenwich",0],UNIT["Degree",0.017453292519943295]
],
PROJECTION["Plate_Carree"],PARAMETER["False_Easting",0],
PARAMETER["False_Northing",0],PARAMETER["Central_Meridian",0],
UNIT["Degree",111319.49079327357264771338267056]]

As far as I know we don’t have a spatial reference ID for the above (EPSG:54001 comes close but uses a different linear unit), so we often incorrectly start using EPSG:4326 to describe a projection. This has been done for so long, that this is now common (mal)practice. Even OGC’s WMS specification allows you request flat maps in a spherical coordinate system, even though this doesn’t really make any sense.

So why is this a problem? Well until recently it hasn’t really been a problem, mostly because it was rare that the spherical coordinate were correctly handled, and most applications assumed that the world was flat. However, Microsoft SQL Server 2008 can correctly handle spherical coordinates, and suddenly this becomes a major problem.

Below is a query on all the counties that follow the red line defined by two points. The blue polygons is the result returned. The map claims that its spatial reference is EPSG:4326. Because of the curvature Earth, a straight line between the two endpoints looks like a curve on the projected map, so the results returned seems like they don’t match with the line, but they are in fact the counties on the line between the two endpoints if you think in a spherical coordinate system.

image

The real problem here is not that the line is not really a curve (I drew the line like that because I want the features along that latitude). The problem is that the line didn’t know that it was projected, because the map it was displayed on was incorrectly set to EPSG:4326. However had the application known that this was not a spherical coordinate system, but a Plate Carree projection, it would have known that when converting from the flat coordinate system to the spherical coordinate system, it should ensure that my line follows the latitude. But because the input line already claims to be in spherical units, the application can not know that it needs to do anything to it (aside the fact that the application of course knows that this came from a flat screen map, but the business logic is of course separate from the UI).

This brings me to another even worse issue: I’d like to make the claim that almost all of the data you have that claims to be in EPSG:4326 has never been EPSG:4326 ! (point data excluded).

Example: Most of the northern US border roughly follows the 49’th latitude. Let’s for sake of argument define the whole northern border as two points, from coast to coast, 49 degrees north. If I then think that my data is in EPSG:4326 (or any other geographic coordinate system), the border will NOT be following the 49th latitude, but go along a great circle that cuts into Canada.

So let us thank Microsoft for creating a database that handles spherical coordinates correctly, and for giving us major headaches when trying to handle these things correctly in a clean clear way :-). Of course there wouldn’t be any headaches if we never mixed spherical and flat coordinate systems in the first place.

Spherical/Web Mercator: EPSG code 3785

I just received an update from the EPSG mailing list:

New to Version 6.15 are (among other things): Added spherical Mercator coordinate operation method and associated CRS as seen in popular web mapping and visualisation applications.

It looks like they FINALLY added the spherical Mercator / Web Mercator projection used in Virtual Earth and Google Maps.

This is a big surprise. EPSG’s earlier statement whether to include it was this:

"We have reviewed the coordinate reference system used by Microsoft, Google, etc. and believe that it is technically flawed. We will not devalue the EPSG dataset by including such inappropriate geodesy and cartography.

Guess they changed their mind, or did they just devalue their dataset? Then again, judging from the remarks EPSG put in there, their arrogance still shines through. There´s absolute nothing wrong with using a sphere instead of a flattened sphere. Sure it's not as accurate as for instance WGS84, but then again WGS84 is not accurate either - no ellipsoid is. But we know the exact differences between the two, and as always you will need to take these things into account so I don´t see the real issue. Viisually the distortion is far less than what you would notice, and when doing area, distance and bearing calculations you would first of all never use the mercator units without taking the projection distortion into account, and if you do your calculationg in long/lat it's more or less just as easy to use WGS84 as a base for your calculations (since no datum transform is really needed).

Anyway, finally we get an official code for "Web Mercator": EPSG:3785 

Here are the details of the entry:

Full WKT with authorities (untested!):
PROJCS["Popular Visualisation CRS / Mercator", GEOGCS["Popular Visualisation CRS", DATUM["Popular Visualisation Datum", SPHEROID["Popular Visualisation Sphere", 6378137, 0, AUTHORITY["EPSG",7059]], TOWGS84[0, 0, 0, 0, 0, 0, 0], AUTHORITY["EPSG",6055]], PRIMEM["Greenwich", 0, AUTHORITY["EPSG", "8901"]], UNIT["degree", 0.0174532925199433, AUTHORITY["EPSG", "9102"]], AXIS["E", EAST], AXIS["N", NORTH], AUTHORITY["EPSG",4055]], PROJECTION["Mercator"], PARAMETER["False_Easting", 0], PARAMETER["False_Northing", 0], PARAMETER["Central_Meridian", 0], PARAMETER["Latitude_of_origin", 0], UNIT["metre", 1, AUTHORITY["EPSG", "9001"]], AXIS["East", EAST], AXIS["North", NORTH], AUTHORITY["EPSG",3785]]
  

Projected CRS
COORD_REF_SYS_CODE: 3785
COORD_REF_SYS_NAME: Popular Visualisation CRS / Mercator   
AREA_OF_USE_CODE: 3544   
COORD_REF_SYS_KIND: projected   
COORD_SYS_CODE: 4499       
DATUM_CODE:
SOURCE_GEOGCRS_CODE: 4055 (see below)
PROJECTION_CONV_CODE: 19847   
CMPD_HORIZCRS_CODE:
CMPD_VERTCRS_CODE:
CRS_SCOPE: Certain Web mapping and visualisation applications.   
REMARKS: Uses spherical development. Relative to an ellipsoidal development errors of up to 800 metres in position and 0.7% in scale may arise. Some applications call this WGS 84. It is not a recognised geodetic system: see WGS 84 / World Mercator (CRS code 3395)   
INFORMATION_SOURCE: Microsoft.
DATA_SOURCE: OGP
REVISION_DATE: 3/14/2008
CHANGE_ID:
SHOW_CRS: TRUE
DEPRECATED: FALSE

Geographic CRS:
COORD_REF_SYS_CODE: 4055
COORD_REF_SYS_NAME: Popular Visualisation CRS
AREA_OF_USE_CODE: 31262
COORD_REF_SYS_KIND: geographic 2D
COORD_SYS_CODE: 6422
DATUM_CODE: 6055 (see below)
SOURCE_GEOGCRS_CODE:
PROJECTION_CONV_CODE:
CMPD_HORIZCRS_CODE:
CMPD_VERTCRS_CODE:
CRS_SCOPE: Certain Web mapping and visualisation applications.
REMARKS: Some applications erroneously call this WGS 84. It uses a sphere with a radius having the same value as the semi-major axis of the WGS 84 ellipsoid. There is no geodetic recognition of this system.
INFORMATION_SOURCE: Microsoft.
DATA_SOURCE: OGP
REVISION_DATE: 3/13/2008
CHANGE_ID:
SHOW_CRS: TRUE
DATUM_CODE: FALSE


Datum:
Code: 6055       
Datum Name: Popular Visualisation
Datum Type: geodetic
Origin Description: Not specified in the classical sense of defining a geodetic datum.
Datum Epoch:
Ellipsoid Code: 7059 (see below)
Prime Meridian Code: 8901
Area Code: 1262
Datum Scope    : Used by certain popular Web mapping and visualisation applications.
Remarks: Not recognised by geodetic authorities.
Information Source: Microsoft.
Data Source: OGP   
Revision Date: 13-Mar-08
Change ID:
Deprecated: No


Ellipsoid:
Code: 7059
Ellipsoid Name: Popular Visualisation Sphere   
Semi-major axis (a): 6378137   
Axes units code: 9001       
Inverse flattening (1/f):
Semi-minor axis (b): 6378137   
Ellipsoid?: No   
Remarks: Sphere with radius equal to the semi-major axis of the GRS80 and WGS 84 ellipsoids. Used only for Web approximate mapping and visualisation. Not recognised by geodetic authorities.   
Information Source: Microsoft.
Data Source: OGP
Revision Date: 14-Mar-08
Change ID:   
Deprecated?: No

Straight lines on a sphere

There was a question in the Sql Server Spatial/Katmai forums about why a straight line on a sphere didn't "look straight".

Katmai both have planar and spherical geometry types. The spherical type makes it easier to handle things like straight lines, distances and areas over large distances, and depending on which type you choose, you can get very different results.

Consider traveling on a straight line from Vancouver to Frankfurt. They are both located roughly at latitude 50°N. So the line would follow latitude 50°N right? Well that's true for a planar coordinate system:

So according to The Flat Earth Society (who actually believes the Earth is flat) the green line above shows the shortest distance between the two cities. But what we are actually seeing is an artifact of working with a planar coordinate system depicting a world that is not planar.

Using a spheric coordinate system, we get a different result. When looking at this line in a projected coordinate system, like the Mercator projection I've used here, the line doesn't look straight (left image below). However if we look at this in a 3D view (right image), it becomes apparent that the "curved line" is actually the shortest line between the two cities.

The difference between using the two geometry types gets really apparent when you try to find the shortest distance from New York to the line in the two coordinate systems. In the planar case, Quebec is approximately the point where the line is the closest to New York. In the spherical case, the line never gets closer to New York than from Vancouver where it started out.

Another way that I like to think of why following a latitude is not the shortest route, is imagining two guys standing a few feet from the North Pole with the pole between them. Which way is the shortest path between them: Walking straight over the pole or following the latitude at 89.999°N around it? Now imagine how this line would look on a map.

We can extend this further and have the two men go further and further away from each other.  If one man gets a little further south than the other, the line wouldn't pass the pole, but go by just next to the it - it still wouldn't follow the latitude. Since the North Pole is just a point we humans "made up", we can abstract it and think of a pole in the ground anywhere on Earth. The bottom line is that the North Pole and the latitudes are all imaginary, and doesn't really exist, and definitely doesn't help describing the shortest distance.

Only at Equator would it be a good idea to follow the latitude, which is because this is the only latitude that is a great circle, and it so happens to be that any straight line between two points will describe parts of a great circle. Longitudes however are all great circles, and the line between the two men describe parts of a longitude. The reason we think that the horizontal line between Vancouver and Germany is the shortest path, is simply because we have to project the round Earth onto a flat piece of paper, and this causes all sorts of things to get distorted.

Accurate distance calculations in UTM projections

Recently a friend of mine asked me what projection would be the best to create point-buffer circles. All map projections adds distortion so you rarely end up with a circle. If you’re lucky, you’ll have an ellipse but often they get even more complex than this. In many cases a “normal” circle is sufficient for accuracy, but still it got me thinking how I would do this 100% accurate. There are many approaches to this, fx. creating a new projection for each point, do the math in spherical coordinate systems etc, but none of them are completely trivial.

The UTM projection is one of the most commonly used projections. It’s fairly accurate to measure from point to point within small distances and close to the meridian, so this post is based on that. Most of the math here can also be applies to Mercator, where the scale reductions are applied to Y instead of X.

The Mercator projection is created by projecting the globe onto a cylinder whose center follows the Earth’s rotation axis. The Transverse Mercator is basically a "tilted" cylinder parallel to equator. Along the line that the cylinder "touches" the surface the distortion is 0, and increasing away from it in the east/west direction. There is no distortion in the North/South direction. The Universal Transverse Mercator is slightly smaller than the globe, so it will intersect the surface two places. This also ensures that the distortion between and around these two lines are minimal. Along the meridian (the center of the two lines) the distortion for the UTM projection is 0.9996, meaning that this is the amount you have to reduce an infinitely small line in the east/west direction (For Mercator this is normally 1 along Equator). As you move away from the meridian, the scale factor increases up toward infinity. Normally UTM projections are used close to the meridian, and every time you get too far east/west, you would switch to use a new UTM projection. That’s why The Earth is divided into 60 UTM ‘zones’, one for each 6 degrees. Often for practical reasons you might want to use a UTM zone even though it’s outside its defined usage area. Here you have to be specifically careful when measuring distances. For example, Denmark is covered by zone 32 and 33, but it’s common to only use zone 32 which means that distance calculations at the east end can be very inaccurate without applying a scale reduction.

Warning: The following contains a lot of math. You can skip to the bottom and download a C# class that does all the calculations for you.

The scale factor SR(x) for any given point at distance 'x' from the meridian is given by:

Since this is the scale reduction at a point, we need to sum up all of these values along a line to find the correct distance, thus the east/west distance from e1 to e0 (expressed in distance from the meridian) becomes an integral expression:

To this you need to add the north/south distance using the well-known Euclidean distance formula.

For atypical UTM using WGS84 ellipsoid and a 500000m false easting it becomes:

If you haven’t refreshed your integral math lately, or just want to write this in pure code, one can also write the expression as:

Where m is the scalefactor at the meridian, r is the earth radius and e1 and e0 have the false easting subtracted.

Often we can do with an approximate value by using the scale reduction between the start and end point. This should only be used on distances <1km in easting because it gets very inaccurate for greater distances.

Simpson’s Rule

One can also use Simpson’s rule for calculating the integral solution. My tests showed it’s a very accurate approximation for this type of integral usually giving millimeter accuracy. It’s defined as:

I performed a few performance tests for 10 million calculations using all four methods for finding a distance in a UTM projection. Below is the processing time for each method:

Euclidean 4.38 s
Average / Linear 4.49 s
Simpsons 6.94 s
Integral 9.26 s

Bottom line of this: If you want performance and distance is small use the averaging method, if you want accuracy, go with the Integral method, or if you want both, use the Simpsons approach.

Distance calculation - example

start point : { E=400,000 ; N=6,100,000 }

end point : { E=600,000 ; N=6,250,000 }

  • Distance using Simpsons rule: 249,942.5569m (error: 0.0003m)
  • Distance with approximate scale reduction: 249936.0046m (error: 6.54m)
  • Distance without scale reduction: 250,000m (error=57.46m)
Where is scale reduction=1?

Solving SR(x) =1 gives us the distance from the meridian where the scale reduction is exactly 1:

Area calculation To calculate the area of a polygon, apply the scale reduction to the line segments and then calculate the area as you normally would.Creating perfect circles

To create a circle with a fixed radius taking scale reduction into account will give you an irregular shape in the projection. You can use the approximate method (using center as scale factor) which will give you an ellipse since the scale factor for x is constant in this case. The formula for approximate circle becomes r2=(SR*x)2+y2 where SR is the scale reduction at the center of the circle.

For "accurate" circles SR becomes dependent on X. To find this solution you need to isolate e1 from the above equations to find the scale corrected distance. My math is too rusty to figure that one out yet, but if you know, feel free to post it in the comments.

You can download a C# class that performs all four types of distance calculations here.

The Microsoft Live Maps and Google Maps projection

I have lately seen several blogposts confused about which datum and projection Microsoft’s Live Maps (Virtual Earth) and Google Maps use. As most people already know by now, they render the round earth onto a flat screen using a Mercator projection.

I think the confusion comes from that they actually use two spatial reference systems at the same time:

  1. Geographic  Longitude/Latitude coordinatesystem based on the standard WGS84 datum.
  2. Mercator projection using a datum based on WGS84, BUT modified to be spheric.

So when is what used?

The Javascript API’s use (1) as input when you want to add points, lines and polygons. That is, they expect you to input any geometry in geographical coordinates, and click events etc. will also return geometry in this spatial reference. This is the coordinate system most javascript developers will use. The API will automatically project it to the spheric mercator projection.

If you want to create image overlays, or roll your own tile server on top of the map, you will need to project your images into a spheric mercator projection. The JavaScript APIs are not able to do this for you.

Here’s a bit of facts about the two projections:

The valid range of (1) is: [-180,-85.05112877980659] to [180, 85.05112877980659].

The valid range of (2) is: [-20037508.3427892, -20037508.3427892] to [20037508.3427892, 20037508.3427892]

Well-known Text for (1):
GEOGCS["GCS_WGS_1984",DATUM["D_WGS_1984",SPHEROID["WGS_1984",6378137,298.257223563]],PRIMEM["Greenwich",0],UNIT["Degree",0.0174532925199433]]

Well-known Text for (2):
PROJCS["Mercator Spheric", GEOGCS["WGS84basedSpheric_GCS", DATUM["WGS84basedSpheric_Datum", SPHEROID["WGS84based_Sphere", 6378137, 0], TOWGS84[0, 0, 0, 0, 0, 0, 0]], PRIMEM["Greenwich", 0, AUTHORITY["EPSG", "8901"]], UNIT["degree", 0.0174532925199433, AUTHORITY["EPSG", "9102"]], AXIS["E", EAST], AXIS["N", NORTH]], PROJECTION["Mercator"], PARAMETER["False_Easting", 0], PARAMETER["False_Northing", 0], PARAMETER["Central_Meridian", 0], PARAMETER["Latitude_of_origin", 0], UNIT["metre", 1, AUTHORITY["EPSG", "9001"]], AXIS["East", EAST], AXIS["North", NORTH]]

Proj.4 definition for (1):
+proj=longlat +ellps=WGS84 +datum=WGS84 +no_defs

Proj.4 definition for (2) (see here for an explanation of the weird ’nadgrids’ parameter):
+proj=merc +a=6378137 +b=6378137 +lat_ts=0.0 +lon_0=0.0 +x_0=0.0 +y_0=0 +k=1.0 +units=m +nadgrids=@null +no_defs

So why this weird extent for the latitude? First of all, the poles in the Mercator projection extends towards infinity, so at some point they have to cut them off (and who cares about ice anyway - apart from that its melting). If you look at (2) these latitude/longitude values projected into the spheric mercator results in a perfect square, fitting perfectly with squared image tiles, that are simple to sub-divide over and over again, as you zoom in. I expect the reason for the spheric datum is for simplicity and perfomance when reprojecting points from longitude/latitude to screen coordinates. Charlie Savage also has a more mathematical approach to deriving these values.

For a quick introduction to projections, coordinate systems and datums see here.

If you want to know more about how these mapping api's work, keep an eye on Jayant's blog.

Update: We now have an offical EPSG code for the projection. See details here.

Spatial references, coordinate systems, projections, datums, ellipsoids – confusing?

People are often mixing the above as if they were one and the same, so here’s a recap of them. One of the things you often find people saying is that “my data is in the WGS84 coordinate system”. This doesn’t really make sense, but I will get back to this later.

This is a very confusing subject, and I might have gotten a few things wrong myself, so please add a comment and I’ll update it ASAP.

Coordinate systems

A coordinate system is simply put a way of describing a spatial property relative to a center. There is more than one way of doing this:

  • The Geocentric coordinate system is based on a normal (X,Y,Z) coordinate system with the origin at the center of Earth. This is the system that GPS uses internally for doing it calculations, but since this is very unpractical to work with as a human being ( due to the lack of well-known concepts of east, north, up, down) it is rarely displayed to the user but converted to another coordinate system.
  • The Spherical or Geographic coordinate system is probably the most well-known. It is based on angles relative to a prime meridian and Equator usually as Longitude and Latitude. Heights are usually given relative to either the mean sea level or the datum (I’ll get back to the datum later).
  • The Cartesian coordinate system is defined as a “flat” coordinate system placed on the surface of Earth.  In some projections it’s not flat in the sense that it follows the earth’s curvature in one direction and has a known scale-error in the other direction relative to the distance of the origin. The most well-known coordinate system is the Universal Transverse Mercator (UTM), but surveyors define their own little local flat coordinate systems all the time. It is very easy to work with, fairly accurate over small distances making measurements such as length, angle and area very straightforward. Cartesian coordinate systems are strongly connected to projections that I will cover later.

Sidenote: The geocentric coordinate system is strictly speaking a cartesian coordinate system too, but this is the general terms I've seen used the most when talking about world coordinate systems.

Geocentric.png Spherical.png Cartesian.png

Datums and ellipsoids

Some of the common properties of the above coordinate systems are that they are all relative to the center of Earth and except the Geocentric coordinate system, uses a height system relative to the surface of the earth.

This poses two immediate problems:

  • Where is the center of the earth
  • What is the shape of the earth?

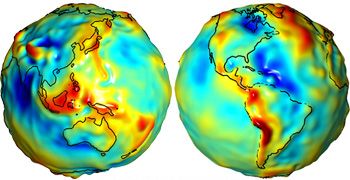
By now most people should know that that the earth isn’t flat (although there are still some who doubts it). If we define the surface of Earth as being at the mean sea level (often referred to as the Geoid), we don’t get a spheroid or even an ellipsoid. Because of gravitational changes often caused by large masses such as mountain ranges etc, Earth is actually very irregular with variations of +/- 100 meters. Since this is not very practical to work with as a model of earth, we usually use an ellipsoid for approximation. The ellipsoid is defined by its semi-major axis, and either the flattening of the ellipoid or the semi-minor axis.

The center and orientation of the ellipsoid is what we call the datum. So the datum defines an ellipsoid and through the use of a set of points on the ground that we relate to points on the ellipsoid, we define the center of the Earth.  This poses another problem, because continental drift moves the points used to define the points around all the time. This is why the name of a datum usually have a year in it, often referring to the position of those points January 1st of that year (although that may vary).

There are a vast amount of datums, some used for measurements all over the world, and other local datums defined so they fit very well with a local area. Some common ones are: World Geodetic Datum 1984 (WGS84), European Datum 1950 (ED50) and North American Datum 1983 (NAD83).

The most well-known is WGS84 used by the GPS systems today. It is a good approximation of the entire world and with fix-points defined almost all over the world. When it was defined they forgot to include points in Europe though, so the Europeans now have their own ETRS89, which is usually referred to as the “realization of WGS84 in Europe”. The problem here was solely because of continental drift, so they defined some points relative to WGS84 in 1989, and keeps track of the changes. In most use-cases it is of no real importance and you can use one or the other.

I mentioned earlier that people often refer to having their data in WGS84, and you see now why this doesn’t make sense. All you know from that is that the data is defined using the WGS84 datum, but you don’t know which coordinate system it uses.

Read more on Datums and Spheroids.

Projections

The earth isn’t flat, and there is no simple way of putting it down on a flat paper map (or these days onto a computer screen), so people have come up with all sorts of ingenious solutions each with their pros and cons. Some preserves area, so all objects have a relative size to each other, others preserve angles (conformal) like the Mercator projection, some try to find a good intermediate mix with only little distortion on several parameters etc. Common to them all is that they transform the world onto a flat Cartesian coordinate system, and which one to choose depends on what you are trying to show.

A common statement that I hear in GIS is the following “My map doesn’t have a projection”, but this is simply not possible (unless you have a good old rotating globe). Often people are referring to data that is in longitude/latitude and displayed on a map without having specified any projection. What happens is that the system applies the simplest projection it can: Mapping Longitude directly to X and Latitude to Y. This results in an equirectangular projection, also called the “Plate Carree” projection. It results in very heavy distortion making areas look squashed close to the poles. You can almost say that the “opposite” of the Plate Carree is the Mercator projection which stretches areas close to the poles in the opposite direction, making them look very big. Mercator is the type of projection you see used on Live maps and Google maps, but as many often mistakenly thinks, they do NOT use WGS84 for the projected map, although WGS84 is used when you directly input longitude/latitude values using their API (read more on this here).

More on projected coordinate systems

Spatial reference

The spatial reference is a combination of all the above. It defines an ellipsoid, a datum using that ellipsoid, and either a geocentric, geographic or projection coordinate system. The projection also always has a geographic coordinate system associated with it. The European Petroleum Survey Group (EPSG) has a huge set of predefined spatial references, each given a unique ID. These ID’s are used throughout the industry and you can download an Access database with all them from their website, as well as some very good documents on projection (or see the Spatial References website).

So when you hear someone saying they have their data in WGS84, you can often assume that they have longitude/latitude data in WGS84 projected using Plate Carree.  The spatial reference ID of this is EPSG:4326.

Spatial References are often defined in a Well-known format defining all these parameters. The Spatial Reference EPSG:4326 can therefore also be written as:

GEOGCS["GCS_WGS_1984",DATUM["D_WGS_1984",SPHEROID["WGS_1984",6378137,298.257223563]],PRIMEM["Greenwich",0],UNIT["Degree",0.0174532925199433]]

As mentioned Live/Google maps use a Mercator projection, but although their datum is based on WGS84, they use a sphere instead of an ellipsoid. This means that they use the same center and orientation as WGS84, but without applying any flattening. The spatial reference string for their projection therefore becomes:

PROJCS["Mercator Spheric", GEOGCS["WGS84based_GCS", DATUM["WGS84based_Datum", SPHEROID["WGS84based_Sphere", 6378137, 0], TOWGS84[0, 0, 0, 0, 0, 0, 0]], PRIMEM["Greenwich", 0, AUTHORITY["EPSG", "8901"]], UNIT["degree", 0.0174532925199433, AUTHORITY["EPSG", "9102"]], AXIS["E", EAST], AXIS["N", NORTH]], PROJECTION["Mercator"], PARAMETER["False_Easting", 0], PARAMETER["False_Northing", 0], PARAMETER["Central_Meridian", 0], PARAMETER["Latitude_of_origin", 0], UNIT["metre", 1, AUTHORITY["EPSG", "9001"]], AXIS["East", EAST], AXIS["North", NORTH]]

Applying on-the-fly transformation in SharpMap

I have received a lot of questions on how to transform data from one coordinatesystem to another on the fly in SharpMap. Usually the problem is that they have data in different coordinatesystems and want to match them. Although I would recommend applying transformations once-and-for-all to increase performance (you could use OGR for this), it is easy to setup in SharpMap. Below are some examples on how to accomplish this.

SharpMap gives you the full power to specify all the parameters in a projection. The following method demonstrates how to setup a UTM projection:

.csharpcode { font-size: small; color: black; font-family: Courier New , Courier, Monospace; background-color: #ffffff; /*white-space: pre;*/ } .csharpcode pre { margin: 0em; } .csharpcode .rem { color: #008000; } .csharpcode .kwrd { color: #0000ff; } .csharpcode .str { color: #006080; } .csharpcode .op { color: #0000c0; } .csharpcode .preproc { color: #cc6633; } .csharpcode .asp { background-color: #ffff00; } .csharpcode .html { color: #800000; } .csharpcode .attr { color: #ff0000; } .csharpcode .alt { background-color: #f4f4f4; width: 100%; margin: 0em; } .csharpcode .lnum { color: #606060; }
/// <summary>
/// Creates a UTM projection for the northern
/// hemisphere based on the WGS84 datum
/// </summary>
/// <param name="utmZone">Utm Zone</param>
/// <returns>Projection</returns>
private IProjectedCoordinateSystem CreateUtmProjection(int utmZone)
{
CoordinateSystemFactory cFac = 
      new SharpMap.CoordinateSystems.CoordinateSystemFactory();
//Create geographic coordinate system based on the WGS84 datum
IEllipsoid ellipsoid = cFac.CreateFlattenedSphere("WGS 84", 
           6378137, 298.257223563, LinearUnit.Metre);
IHorizontalDatum datum = cFac.CreateHorizontalDatum("WGS_1984", 
                     DatumType.HD_Geocentric, ellipsoid, null);
IGeographicCoordinateSystem gcs = cFac.CreateGeographicCoordinateSystem(
                     "WGS 84", AngularUnit.Degrees, datum,
                     PrimeMeridian.Greenwich,
                     new AxisInfo("Lon", AxisOrientationEnum.East),
                     new AxisInfo("Lat", AxisOrientationEnum.North));
//Create UTM projection
List<ProjectionParameter> parameters = new List<ProjectionParameter>(5);
parameters.Add(new ProjectionParameter("latitude_of_origin", 0));
parameters.Add(new ProjectionParameter("central_meridian", -183+6*utmZone));
parameters.Add(new ProjectionParameter("scale_factor", 0.9996));
parameters.Add(new ProjectionParameter("false_easting", 500000));
parameters.Add(new ProjectionParameter("false_northing", 0.0));
IProjection projection = cFac.CreateProjection(
"Transverse Mercator", "Transverse_Mercator", parameters);
return cFac.CreateProjectedCoordinateSystem(
         "WGS 84 / UTM zone "+utmZone.ToString() +"N", gcs,
projection, LinearUnit.Metre,
new AxisInfo("East", AxisOrientationEnum.East),
new AxisInfo("North", AxisOrientationEnum.North));
}

If you have a well-known text-representation, you can also create a projection from this. A WKT for an UTM projection might look like this:

PROJCS["WGS 84 / UTM zone 32N",GEOGCS["WGS 84",DATUM["WGS_1984",SPHEROID["WGS 84",6378137,298.257223563,AUTHORITY["EPSG","7030"]],AUTHORITY["EPSG","6326"]],PRIMEM["Greenwich",0,AUTHORITY["EPSG","8901"]],UNIT["degree",0.01745329251994328,AUTHORITY["EPSG","9122"]],AUTHORITY["EPSG","4326"]],PROJECTION["Transverse_Mercator"],PARAMETER["latitude_of_origin",0],PARAMETER["central_meridian",9],PARAMETER["scale_factor",0.9996],PARAMETER["false_easting",500000],PARAMETER["false_northing",0],UNIT["metre",1,AUTHORITY["EPSG","9001"]],AUTHORITY["EPSG","32632"]]

SharpMap comes with WKT parsers for parsing a WKT to a coordinate system (note: the current v0.9RC1 has a few bug in its WKT parser, but if you get problems parsing the WKT, use the current source from the repository, where these issues have been resolved)

/// <summary>
/// Create coordinatesystem based on a Well-Known text
/// </summary>
/// <param name="wkt"></param>
/// <returns></returns>
private ICoordinateSystem CreateCoordinateSystemFromWKT(string wkt)
{
CoordinateSystemFactory cFac = new CoordinateSystemFactory();
return cFac.CreateFromWkt(strProj);
}

If your data is based on shapefile data and they have a .prj file defining the coordinatesystem, you can simply retrieve the CS from the shapefile instead:

((myMap.Layers[0] as VectorLayer).DataSource as ShapeFile).CoordinateSystem

The next step is to create a transformation between two coordinate systems. SharpMap currently supports transforming between a geographic coordinate system and one of the following projections:

  • Mercator 1-standard parallel (Mercator_1SP)
  • Mercator 1-standard parallels (Mercator_2SP)
  • Transverse mercator (Transverse_Mercator)
  • Lambert Conic Conformal 2-standard parallel (Lambert Conic Conformal (2SP))
  • Albers

Unfortunately datum-shifts and transformations between two projections are still down the pipeline, but the above will be sufficient in most cases. (for those interested full transformation between all supported projections as well as datum-shifts are almost done...)

The following shows how to create a transformation and apply it to a vectorlayer (only vector- and label-layers supports on-the-fly transformations):

//Create zone UTM 32N projection
IProjectedCoordinateSystem utmProj = CreateUtmProjection(32);
//Create geographic coordinate system (lets just reuse the CS from the projection)
IGeographicCoordinateSystem geoCS = utmProj.GeographicCoordinateSystem;
//Create transformation
CoordinateTransformationFactory ctFac = new CoordinateTransformationFactory();
ICoordinateTransformation transform = 
   ctFac.CreateFromCoordinateSystems(source, target);
//Apply transformation to a vectorlayer
(myMap.Layers[0] as VectorLayer).CoordinateTransformation = transform;

Happy transforming!

A basic survival guide to coordinate systems

Charlie Savage has a great post introducing coordinate systems in his blog. I too have had many questions on coordinate systems, projections and datums, and Charlie have made a great introduction to the world of "spatial reference systems". He promises to post some more on the topic, so keep track of his blog if you find these topics confusing (I know I did when I first was told about datums and coordinate systems).